Have you ever been to a board meeting with sales reports that display great numbers and then find out that the revenue is actually declining? This contradiction almost resulted in a loss of £300,000 for a Birmingham manufacturing client before we figured out what the problem was.
Targets were achieved by the sales team. Marketing metrics were excellent. But still the profits were going down. The problem was not performance but visibility. Each department was monitoring different numbers and there was no unified view of what actually mattered.
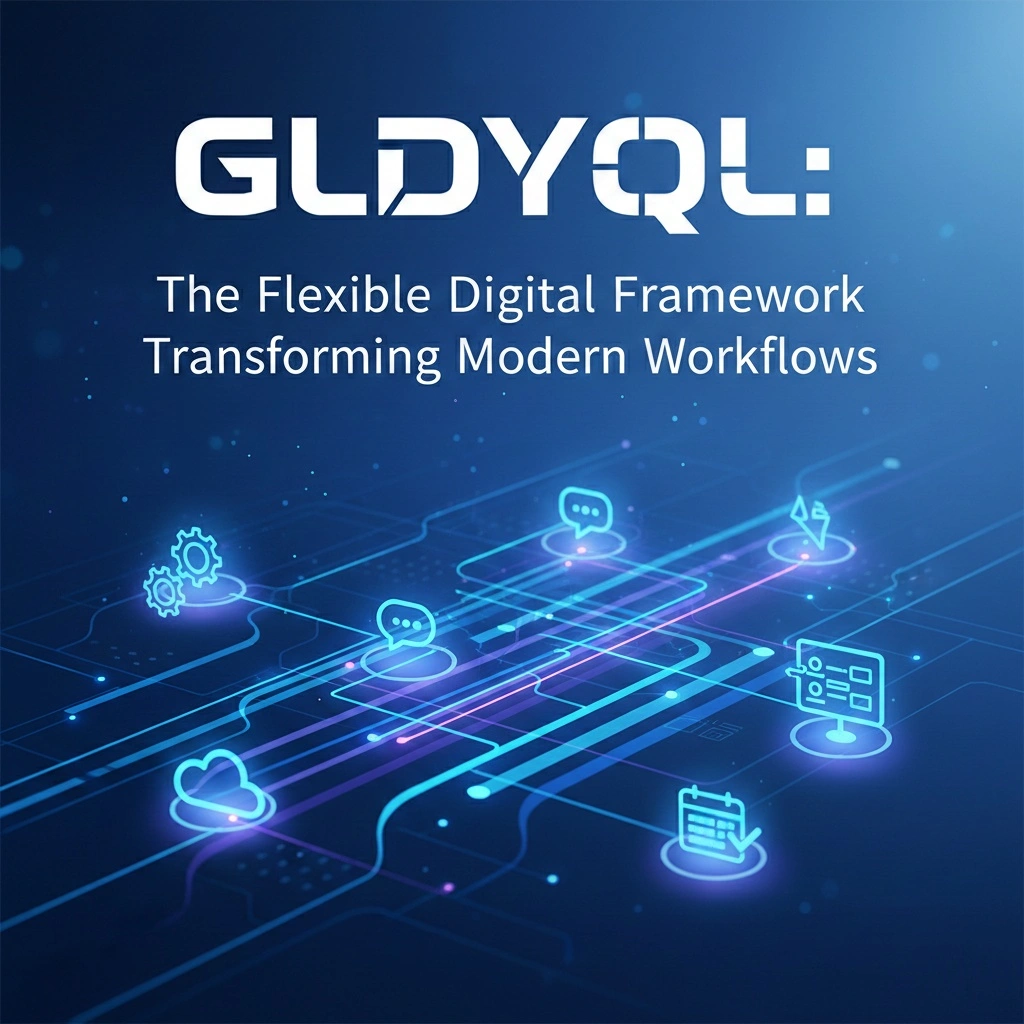
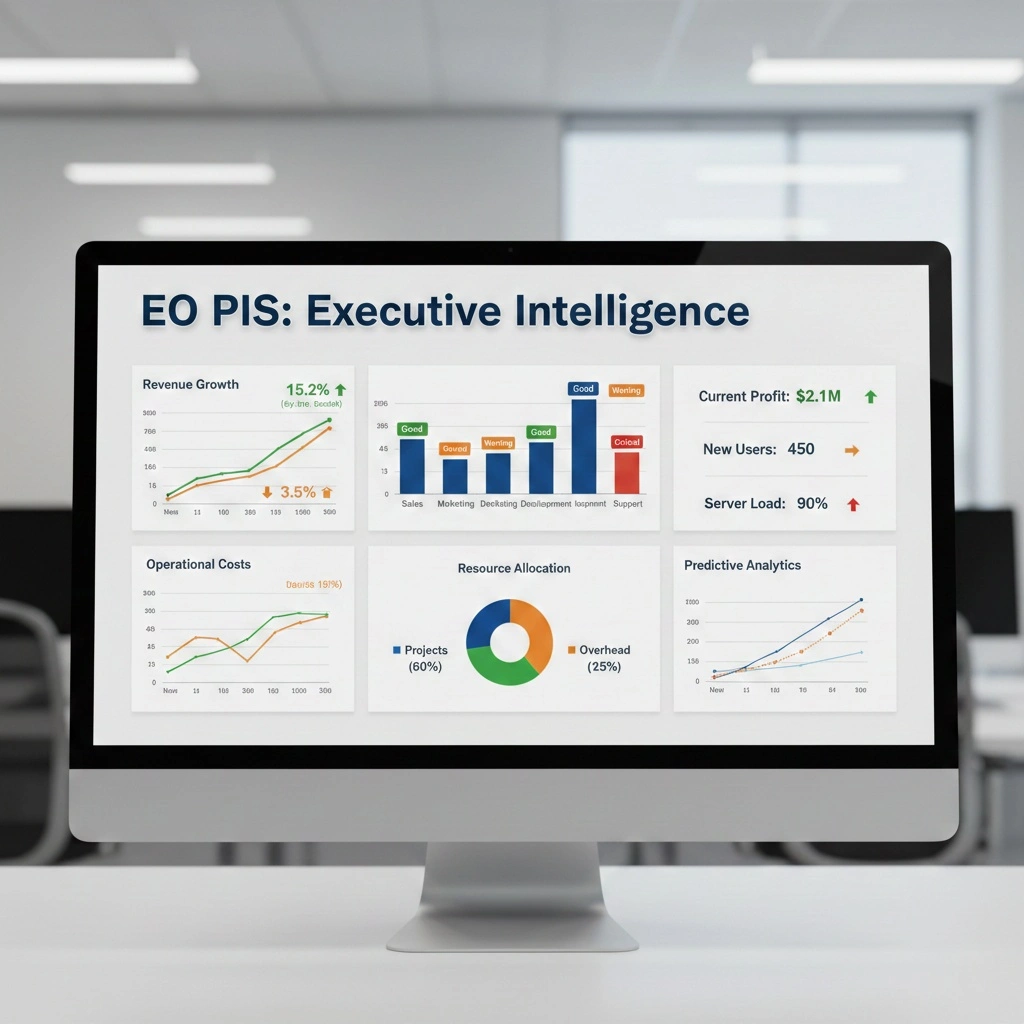
This very scenario occurs in UK boardrooms every day. Executives are overwhelmed with disconnected spreadsheets while the real plot remains concealed. EO PIS—Executive Operations Performance Indicator System—solves this problem by merging the fragmented data into one coherent dashboard that shows the truth, not just numbers.
What EO PIS Actually Means for UK Businesses
EO PIS is an acronym for Executive Operations Performance Indicator System, which is a framework that integrates and displays different departments’ performance indicators through real-time executive dashboards. This system, as opposed to traditional KPIs, which are limited to the specific measurements of the respective departments, connects the operational data straight to the strategic with great results.
It is like having your business translator, who translates “What happened in marketing?” into “Here is how marketing activities impacted revenue, customer retention, and strategic goals.”
The system pools performance data from the finance, sales, HR, and operations departments into a unified view that executives can watch in real time. A Leeds-based financial services company found that their “successful” customer acquisition campaign was drawing in clients with 40% lower lifetime value, a pattern that remained hidden until EO PIS linked acquisition costs to retention data.
The framework is in complete contrast to End-of-Period reporting systems. Instead of waiting for monthly closings, executives get live data streams that allow them to make proactive interventions before the problems get bigger.
Why Traditional KPIs Keep Failing Leadership Teams
The conventional KPI tracking has resulted in the creation of dangerous blind spots. Departments keep on optimizing their metrics without realizing their impact on the organization.
I saw the Manchester retailer celebrating record website traffic while the sales in the store dropped by 28%. The digital marketing department had achieved all the targets set for them. The disconnection? Online visitors were not turning into buyers, which the metrics of their respective departments could not reveal.
The traditional KPIs measure static indicators such as sales revenue or growth rate without explaining the changes that have taken place or predicting what will happen next. Therefore, you will be able to see the symptoms but fail to understand the causes.
EO PIS, on the other hand, provides contextual intelligence. When the Newcastle logistics company adopted the framework, they realized that “on-time” deliveries were actually annoying customers because they happened during the inconvenient windows, although the company was meeting its obligations as per the contract. Customer satisfaction was declining; however, traditional metrics still indicated success.
The system uncovers the links between the indicators that seem to be unrelated. It assesses current performance against historical trends, thus identifying the patterns that forecast future outcomes rather than just informing about what has already occurred.
Core Components That Power Effective Dashboards
The establishment of a powerful framework necessitates the cooperation of four interdependent elements working in unison.
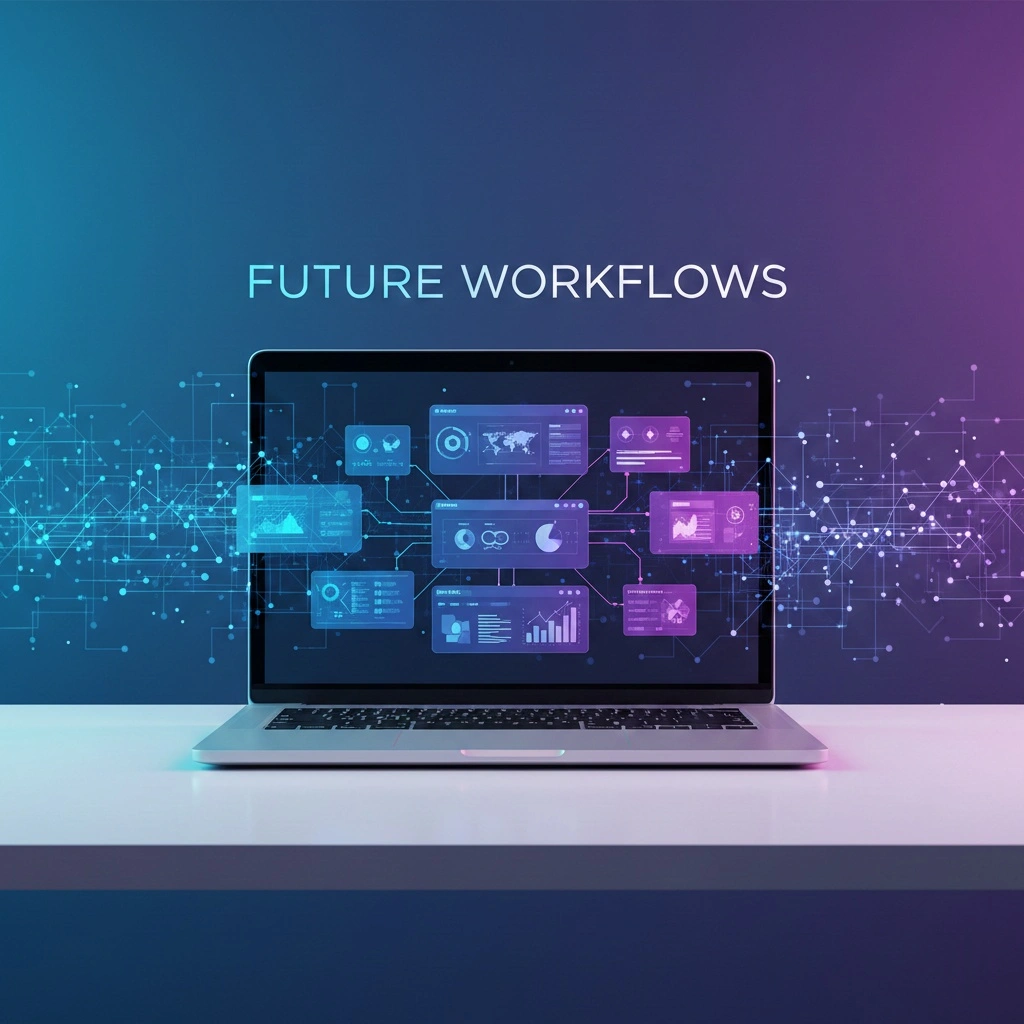
Centralized Executive Dashboard This platform grants the ability to the head managers to quickly observe the most important metrics across the organization. A tech company from Birmingham has lowered the time for preparing board meetings from 12 hours to just 45 minutes as a result of having one unified view instead of departmental presentations.
The dashboard is not merely visually appealing charts; It is a diagnostic tool granting the possibility to answer “”Why is this happening?”” in addition to “”What’s happening?”” Glasgow financial services executives have the possibility to dive from high-level revenue trends into regional-specific performance, product mix, and customer segments—all that, from one screen.
Customizable Performance Metrics Organizations are allowed to customize the metrics to monitor the indicators that are most important for their particular strategic objectives. ‘One size fits all’ tactics are a failure because each and every business is built through different processes.
A healthcare provider in Cardiff is capable of monitoring patient satisfaction, staff utilization, and treatment outcomes simultaneously. Inventory turnover, margin by category, and supply chain efficiency are tracked by their retail neighbors. Same system around but totally different purposes.
Predictive Analytics Engine Machine learning algorithms predict trends and risks even before they happen. This converts management from a reactive approach of putting out fires to a proactive one of strategy making.
A manufacturer from Southampton is able to predict equipment failures 72 hours ahead by scrutinizing performance patterns that are beyond the capability of human observation. Maintenance people prevent disturbances instead of taking care of breakdowns.
Automated Alert Systems Configurable notifications are set to trigger when the KPIs fall below a certain level or when anomalies are detected in the data. Executives do not have to keep a constant watch on the dashboards—the system will inform them when their input is needed.
A financial services company from Bristol gets notified immediately when there is a rise in customer churn indicators. The company’s retention staff takes action before the cancellations occur and manages to retrieve 34% of the at-risk accounts that would have been lost.
Real Implementation Across UK Industries
The framework is not limited to the standard corporate scenarios but is very flexible and can be adjusted to various business situations.
Financial Services Transformation London payment processors that have adopted EO PIS have gained 22 milliseconds on fraud detection when compared to the traditional systems. The automatic streaming of data from ERP, CRM, and supply chain systems helps management to identify minute disturbances immediately.
One of the financial technology startups reduced the number of false alarms in the case of fraud warnings by 47% while increasing the number of detected suspicious activities by 18%. The innovation captures the trends that are not at all noticed by the other obsolete rule-based systems.
Manufacturing Intelligence Connected factories monitor machine productivity, product quality, and idleness using unified panels. An auto parts supplier from Coventry integrated production data with supply chain metrics and demand forecasts.
They realized that pushing production to meet deadlines actually raised defect rates, which resulted in costly returns and loss of customers. They found that a production slowdown of 8% would be enough to enhance quality metrics and eventually cut the overall costs by 12%.
Healthcare Applications Hospitals assess their workforce distribution, and patient contentment levels are measured, and waiting times are recorded through intricate frameworks. The NHS trusts in Southampton were the first to use systems that could predict A&E congestion 48 hours in advance.
The proactive rescheduling of staff prevented the crisis instead of manipulating the situation just after the queues appeared. There was an increase in patient satisfaction without a rise in costs, only through the clever use of the existing resources.
Retail Performance Optimization Retailers simultaneously look at sales by area, product, and supply chain. A Wales-based retailer found out the reasons for 23% difference in performance between the stores located in the same demographic area.
The top stores had a stock that was exactly what the locals liked even though demographics could not predict it. Applying the knowledge gained from the high performing stores to the low performing ones resulted in an overall increase in revenue of £1.2 million per year.
Building Your Framework: Practical Implementation Steps
Success can be seen through different patterns and ways if only the common mistakes that most initiatives usually face here are avoided.
Define Strategic Objectives First Start by deciding which outcomes are of great importance—growth, profitability, and customer satisfaction. Do not let available data dictate your priorities; rather, let the decisions you want to improve serve as your starting point.
The manufacturer of Leeds had a hard time deciding which metrics they needed to track. However, the question we posed above: “What decisions make you lose sleep at night?” helped them in that area. That clarity showed they needed indicators for supply chain risks and not the 30+ vanity metrics they had previously collected.
Start Small and Prove Value Start with a couple of key metrics for one department, deliver quick wins, and then expand out across the company. Stock changes with a broad scope are usually met with strong resistance when their complexity is too much for the team to handle.
A marketing agency in Bristol introduced five metrics that focused only on their sales pipeline. In just six weeks, they were able to find out that there were stalled opportunities amounting to £180,000 that nobody was tracking. This success was what led the management to allow the implementation of the metrics over a wider area.
Pick the Right Technology In the beginning, you don’t require costly enterprise solutions. A lot of organizations can start with the dashboards they already have. It is possible for Microsoft Power BI, Tableau, or even well-prepared Excel to be the ones for pilot implementations.
A startup in Manchester has gotten great results with an annual subscription of £5,000 because it was well-suited to their team. They did not take up the £200,000 enterprise platform which would have been more than their need for features delivered and thus, the platform was shelved.
Data Sources Integration with Caution Audit the metrics that exist with inter-departmental movements very well before creating dashboards. A Newcastle based company found out that their ‘order completion’ metric had three different meanings in three different systems.
Settling those disputes avoided a situation where insights would be meaningless due to their being muddled up in dashboard chaos. The mapping work that was very painstaking but done upfront saved a lot of frustration during the implementation phase.
Training for Interpretation Conduct training sessions for interpreting metrics and generating insights rather than just operating the software. Technical expertise doesn’t mean anything if the executives can’t understand the data.
A tech company in Glasgow devoted two full days to training managers on dashboard interpretation. The investment reaped the reward when they detected an issue in customer service that was costing £50,000 in quarterly churn before it reached the critical stage.
Critical Mistakes That Guarantee Failure
I have seen these mistakes wipe out the whole implementation process in no time, and this happened in several UK firms.
Metric Overload A large number of metrics is not necessary; only the ideal 10 are needed. A technology company in Cardiff wanted to monitor 43 different KPIs at the same time, and their dashboard became a useless noise.
The executives could not point out the things that really mattered. Eventually, we cut down to 11 major indicators and the adoption rate rose from 22% to 87% in just three months.
Poor Data Quality Very attractive dashboards created on low-quality data only quicken incorrect decisions. A retailer from Southampton unearthed the fact that their inventory system had 18% faulty data. Before building the visuals, we cleared up the basic data issues.
Lack of Executive Commitment It is an absolute must to have a visible C-suite champion for the smooth adoption. A financial services firm in Birmingham spent £80,000 but the CEO had never really used the system, choosing instead to have traditional reports once a month.
The teams soon quit it when they found out that the management was not involved. The CFO at Siemens took quite a different route—he would not look at any reports not shown through the EO PIS dashboard. Before long, 70% of the leaders had willingly embraced it.
Unrealistic Expectations The framework does a great job in presenting the insights but does not participate in the decision-making process. A startup in Newcastle thought that their dashboard would “automatically optimize operations.” When it did not happen, they felt dejected even though they had much better visibility than before.
Narrow down the expectations; the EO PIS system bestows decision-making but that does not mean that humans will not have to decide and act.
The AI-Powered Evolution Coming Next
Present-day actions only reveal the tip of the iceberg of the integrated performance systems’ potential.
Incorporation of Machine Learning Next-generation setups will rely on predictive algorithms to project results with a higher degree of reliability than the conventional method can offer. UCL researchers reported their first findings of customer churn signals that were detected with 87% accuracy three months prior to defection.
The introduction of early warning systems will bring about a change in the top management’s approach from solving problems reactively to capturing opportunities proactively. Just think of the scenario where you can pinpoint which customers are going to leave in the next quarter with a high level of confidence to be able to intervene correctly.
Intelligence Activated by Voice The future technology will provide support for using voice as an interface of communication for the executive dashboard where the president will be able to ask a question and get the visual analysis immediately. For example, instead of going through the menus, one can simply ask, “Can you tell me the factors that are causing the margin to decline in the Northeast region?”
Start-ups in London are working on these features with an aim to launch them by 2026. Natural language processing will make data access available to all, not just to the technical users.
Custom-made Executive Interfaces The systems will identify the metrics that each leader uses the most often and will consequently highlight the insights that are most relevant for that leader automatically. Initial trials indicate up to 40 percent faster information retrieval time with comparison to static formats.
Your personalized dashboard changes with your position, your priorities, and even the time of day—exposing different insights for strategic planning versus operational reviews.
Getting Started: Your First 30 Days
Usually, organizations that seek for guidance on where to start can get a lot from this organized method.
Week 1: Capabilities Assessment Honestly map your existing systems, data quality, and team skills. Score yourself in five areas: data infrastructure, analytical capability, executive engagement, change management capacity, and budget availability.
In case any score is lower than 6/10, you should first fix that area before continuing. Don’t put up a building on a shaky ground.
Week 2: Pain Point Identification Look to your leadership team for the answers to the question: what repetitive decisions take too long or hard to rely on instinct only? Such a question highlights the exact spot where the EO PIS project gives the fastest return.
One of the outcomes of the consultations was that a Manchester retailer pointed the finger at inventory optimization as their greatest trouble spot. We laid our focus there initially instead of trying to push through extensive refurbishment all at once.
Week 3: Minimal Dashboard Build Develop a straightforward and concise dashboard that shows the selected metrics on a single screen for weekly reviews by the top management. One area of decision-making typically takes about 3–4 weeks and costs £10,000–£15,000.
Redirect your efforts towards demonstrating value quickly instead of creating the perfect system. The pursuit of perfection leads to a halt in progress.
Week 4: Team Training and Refinement Conducting diagnostic sessions where teams give the reason for every KPI—if it does not cause action, then do away with it. This rigor keeps dashboards from becoming obsolete over time.
A Birmingham manufacturer set up a ‘dashboard steward’ position solely for the purpose of overseeing and staying on top of their system. That ownership kept the system relevant for three years while initiatives in other peer companies went under.
Key Takeaways for UK Business Leaders
The actual application of these frameworks in various types of organizations has shown a lot of basic truths.
Visibility of the metrics across the whole organization has a huge impact on the behavior within the organization. The Political struggles regarding “whose metrics matter more” vanish once all the people inside the organization are watching the same performance story. A Cardiff based manufacturer experienced shorter executive meetings by 60%—they shifted from arguing about the truth to making decisions on actions.
In the context of strategy, speed is more important than perfection. Managers take approximately accurate insights there and then instead of waiting for perfectly accurate data. A Birmingham retailer that updates its dashboards every hour allows a 2-3% error margin in return for getting the early signs. The precious tradeoff keeps on being valued.
Integration costs go continually down as SaaS platforms get more mature. Off-the-shelf connectors for the major business apps minimize the need for custom development. A Leeds based startup finished integration in 11 days—compared to 6 weeks just 3 years back for the same task.
Prevention is always better than cure and it applies to this situation where the early warning system is always going to beating the post-mortem analysis. The highest benefit comes from predictive alerts and not from historical reporting. A Newcastle based financial services company identified compliance risk 19 days ahead of it being a case of regulatory penalties. That one alert was the one reason for their implementation cost of £45,000.
Cultural change is the main reason for the adoption and not technical excellence. The logistics company in Manchester made it because their CEO talked about the dashboard at every meeting. The engagement of the leadership team was more important than the advanced capabilities of the system.
EO PIS is beyond better visibility, in fact it is a significantly improved strategic capability for UK firms that are dealing with economic uncertainty, regulatory complexity, and competitive pressure in 2025.